Mode Waters
Mode Waters summarizes detected mode water layers by three-month period, with profile counts and thickness statistics.
To inspect the same detections on individual map markers, use the Mode Water Data Layer.
Accessing Mode Waters
Mode Waters is available to signed-in users.
- Sign in to OceanGraph
- Open the app menu
- Select Visual Lab > Mode Waters
Results Display
The panel displays:
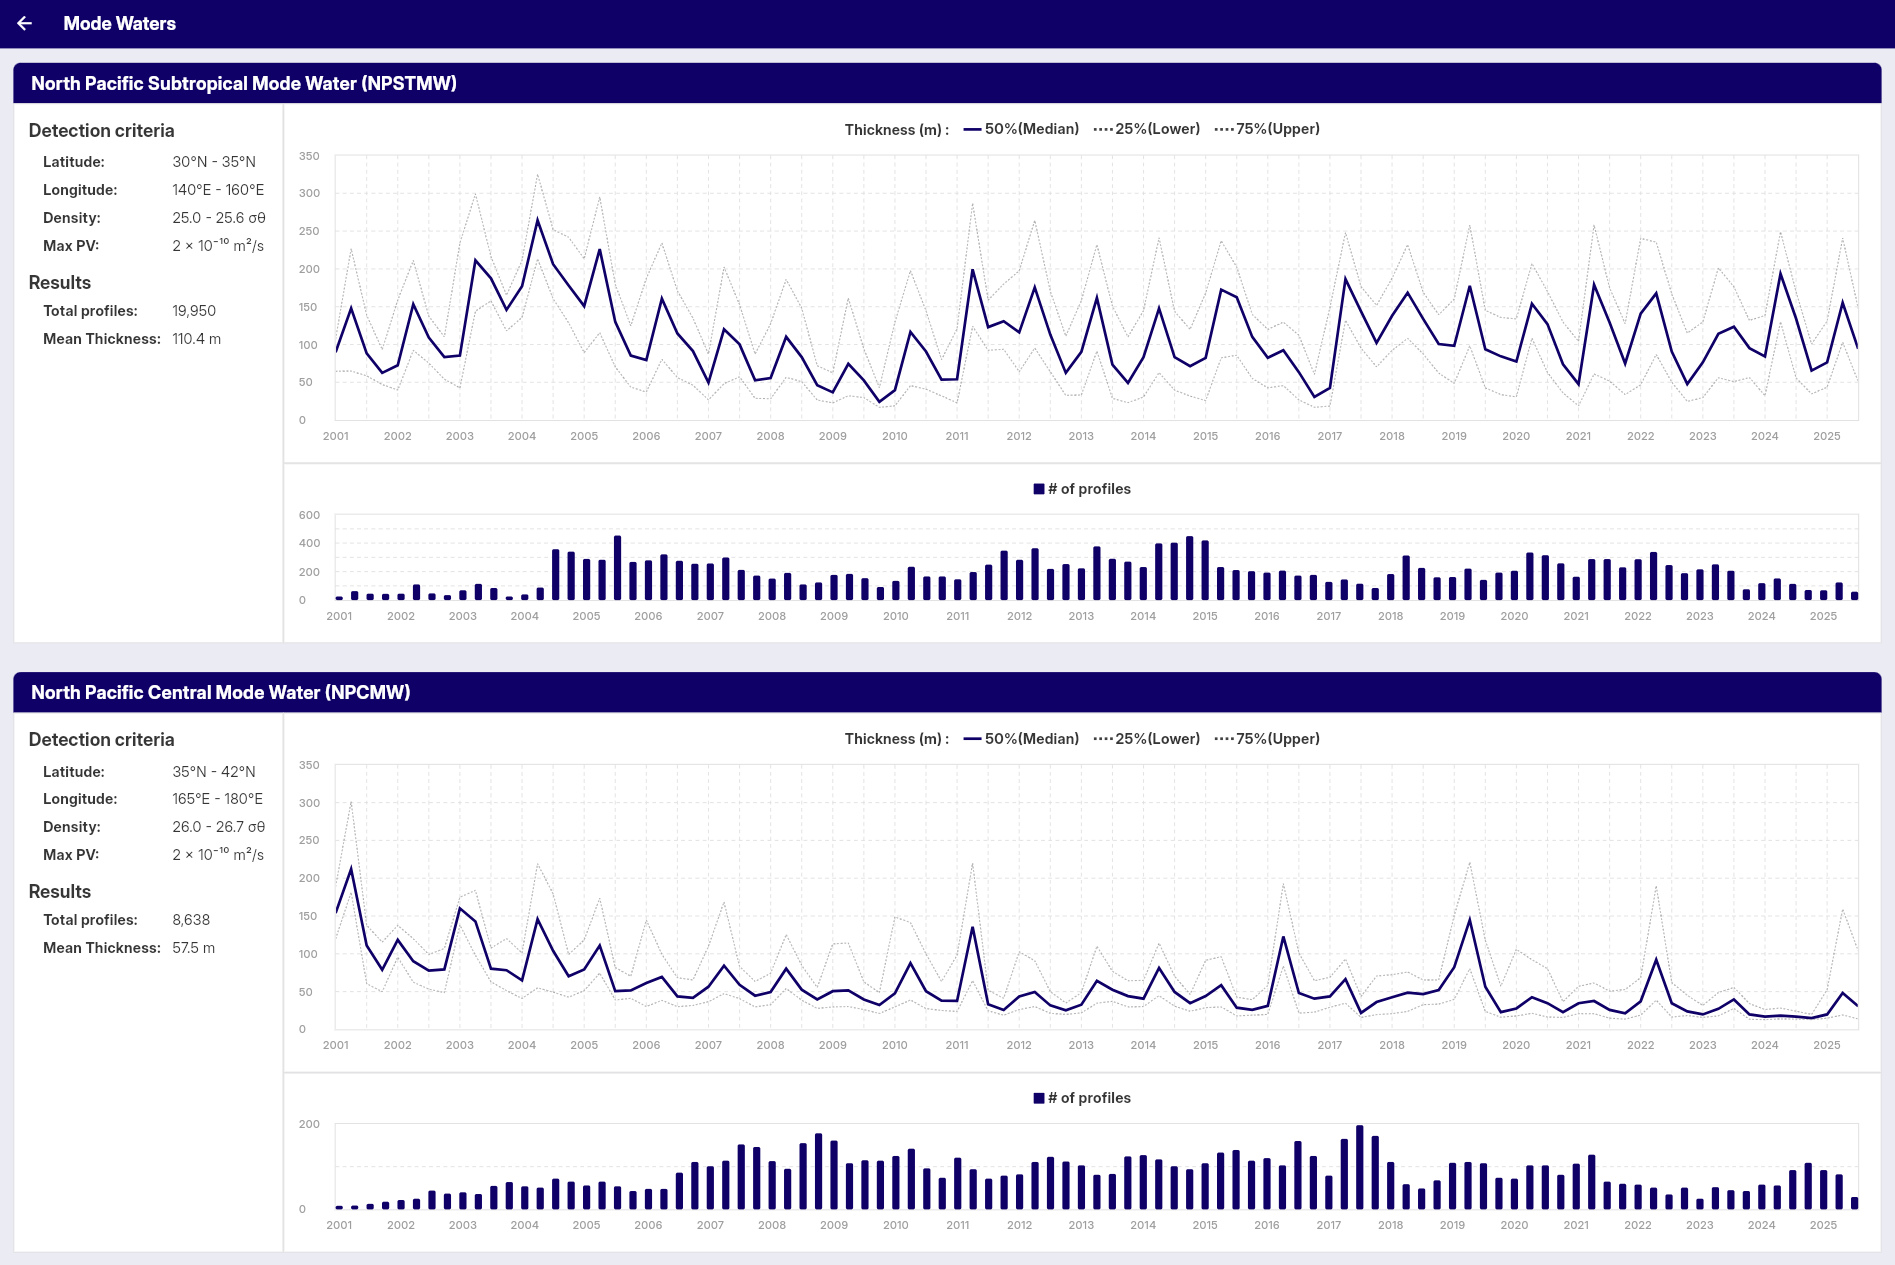
- Total Profiles: Number of profiles containing detected mode water layers
- Mean Thickness: Average of the three-month median thickness values shown in the time series
Graphs
Time Series Graph
Displays mode water thickness over time:
- Median Thickness: 50th percentile (solid blue line)
- Lower Quartile: 25th percentile (dashed gray line)
- Upper Quartile: 75th percentile (dashed gray line)
- Time Scale: Three-month periods from 2001 onwards
Profile Count Graph
Shows the number of profiles containing mode water:
- Blue Bars: Number of profiles per three-month period
- Time Scale: Three-month periods from 2001 onwards
Included Profiles
Detection uses the geographic bounds, density range, and potential vorticity threshold displayed on screen. Only profiles inside that region that reach at least 500 dbar and contain enough finite pressure, temperature, and salinity values are analyzed. Detected layers must be at least 10 m thick. Where potential vorticity cannot be calculated at a depth, the density criterion is used alone. These automatic criteria support exploration; they do not guarantee a research-grade water-mass classification.
Three-Month Periods
Data is grouped by month rather than by hemisphere-specific season names:
- DJF: December, January, February
- MAM: March, April, May
- JJA: June, July, August
- SON: September, October, November
Northern and Southern Hemisphere seasons are opposite, so a label such as DJF identifies only the months, not a local season. DJF uses the year of January and February: 2024 DJF covers December 2023 through February 2024. Graph tooltips show only the concrete month range, such as Dec 2023–Feb 2024 or Mar–May 2024.
Related Reading
For background on mode-water formation and interpretation, read What Is Mode Water? in OceanGraph Articles.