Mode Water Data Layer
OceanGraph can color search-result map markers by profile-level mode water detection. This helps you inspect where individual profiles match a selected mode water type, and how thick the detected layer is.
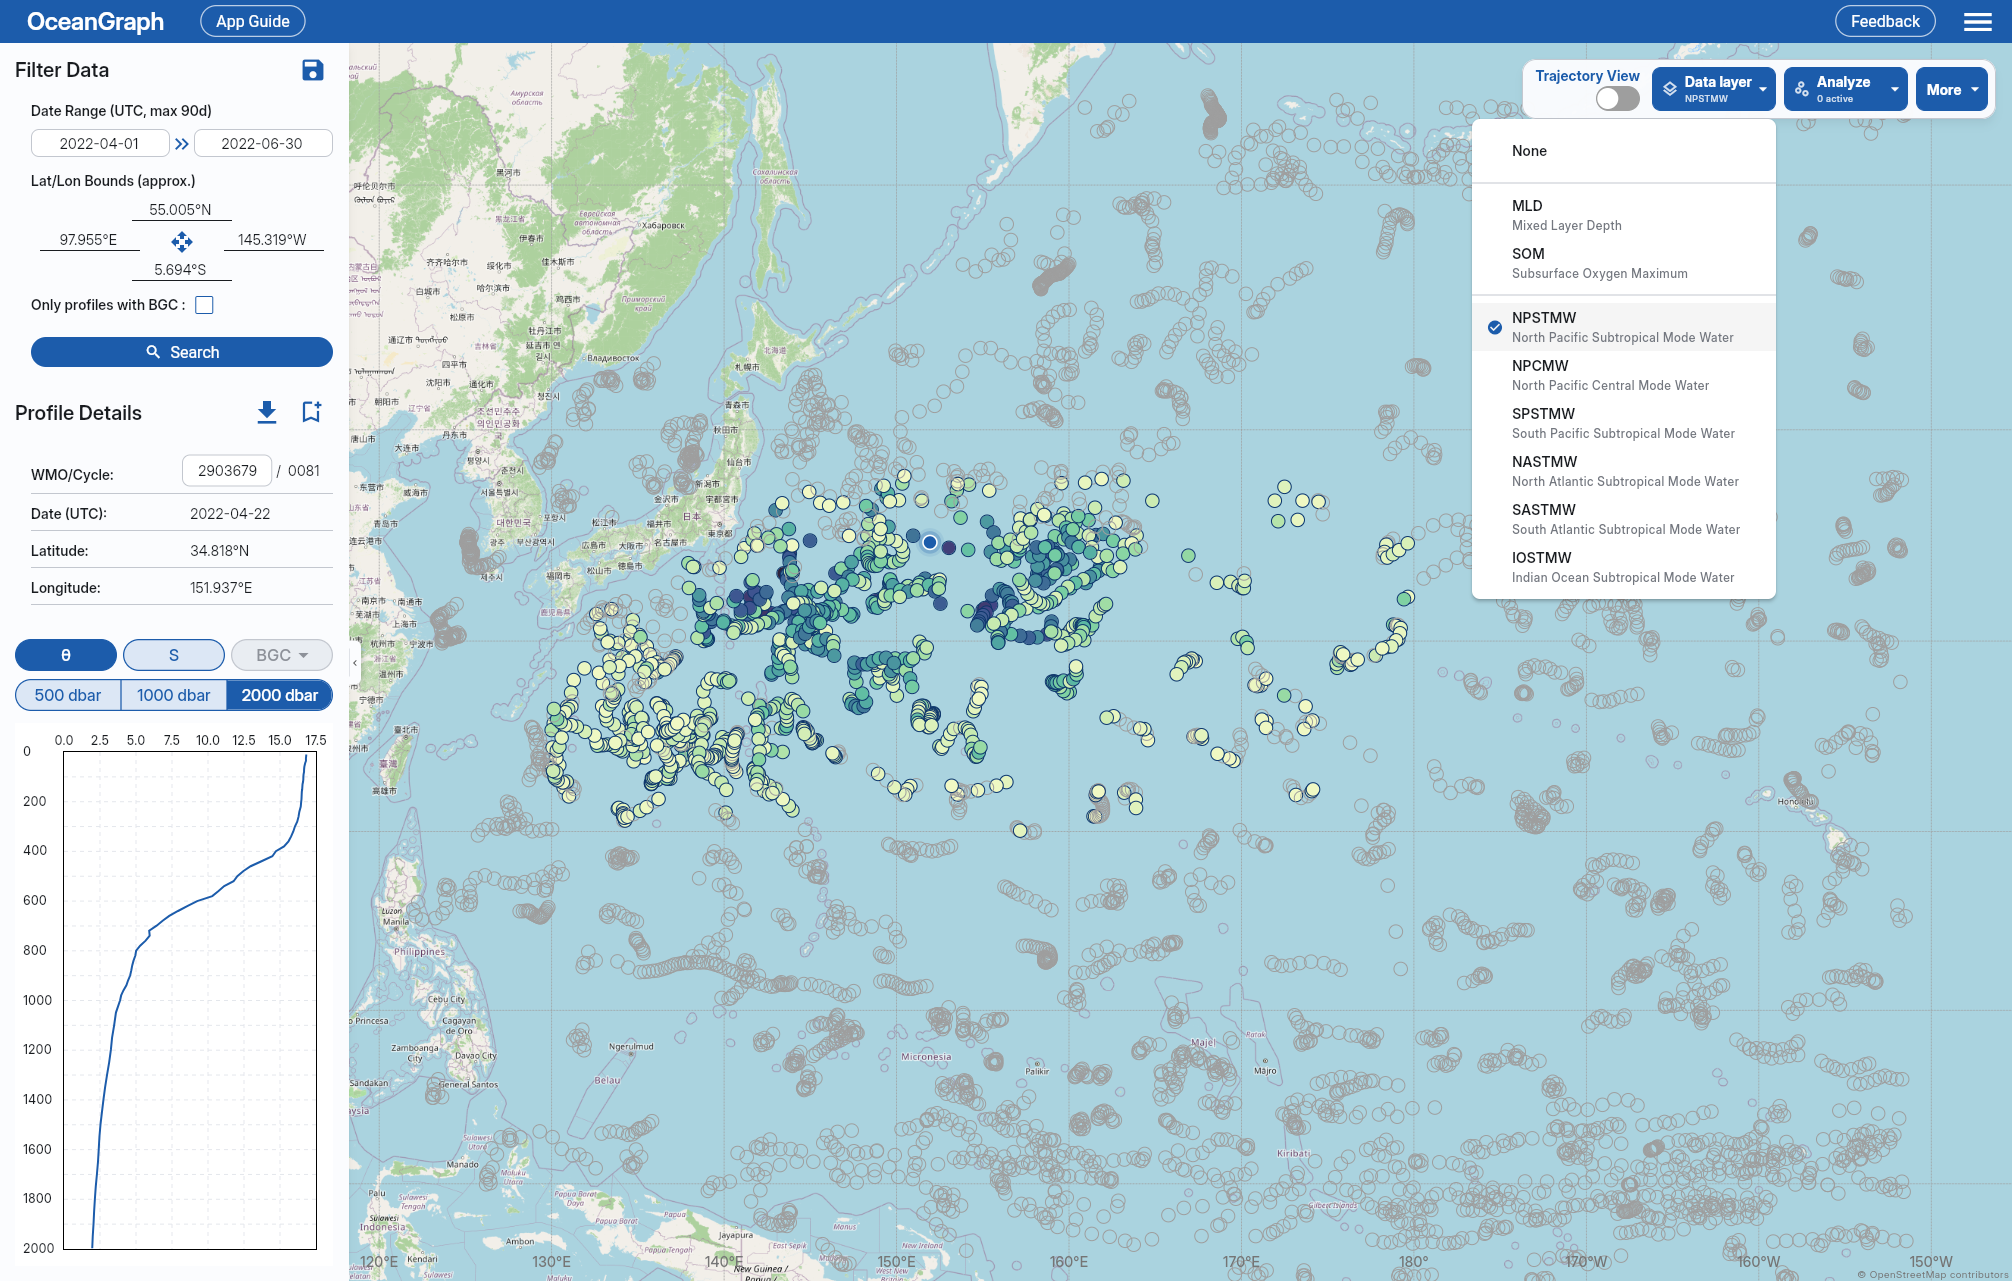
This data layer is separate from Visual Lab > Mode Waters. The data layer works on the profiles in your current search results, while Visual Lab shows precomputed three-month summaries and time series.
Accessing the Data Layer
The mode water data layer is available to signed-in users.
- Sign in and perform a search
- Open Data layer in the map command bar (or under Tools on a narrower layout)
- Choose one mode water type, such as NPSTMW or NASTMW
- Use marker colors and tooltips to compare detected layer thickness across profiles
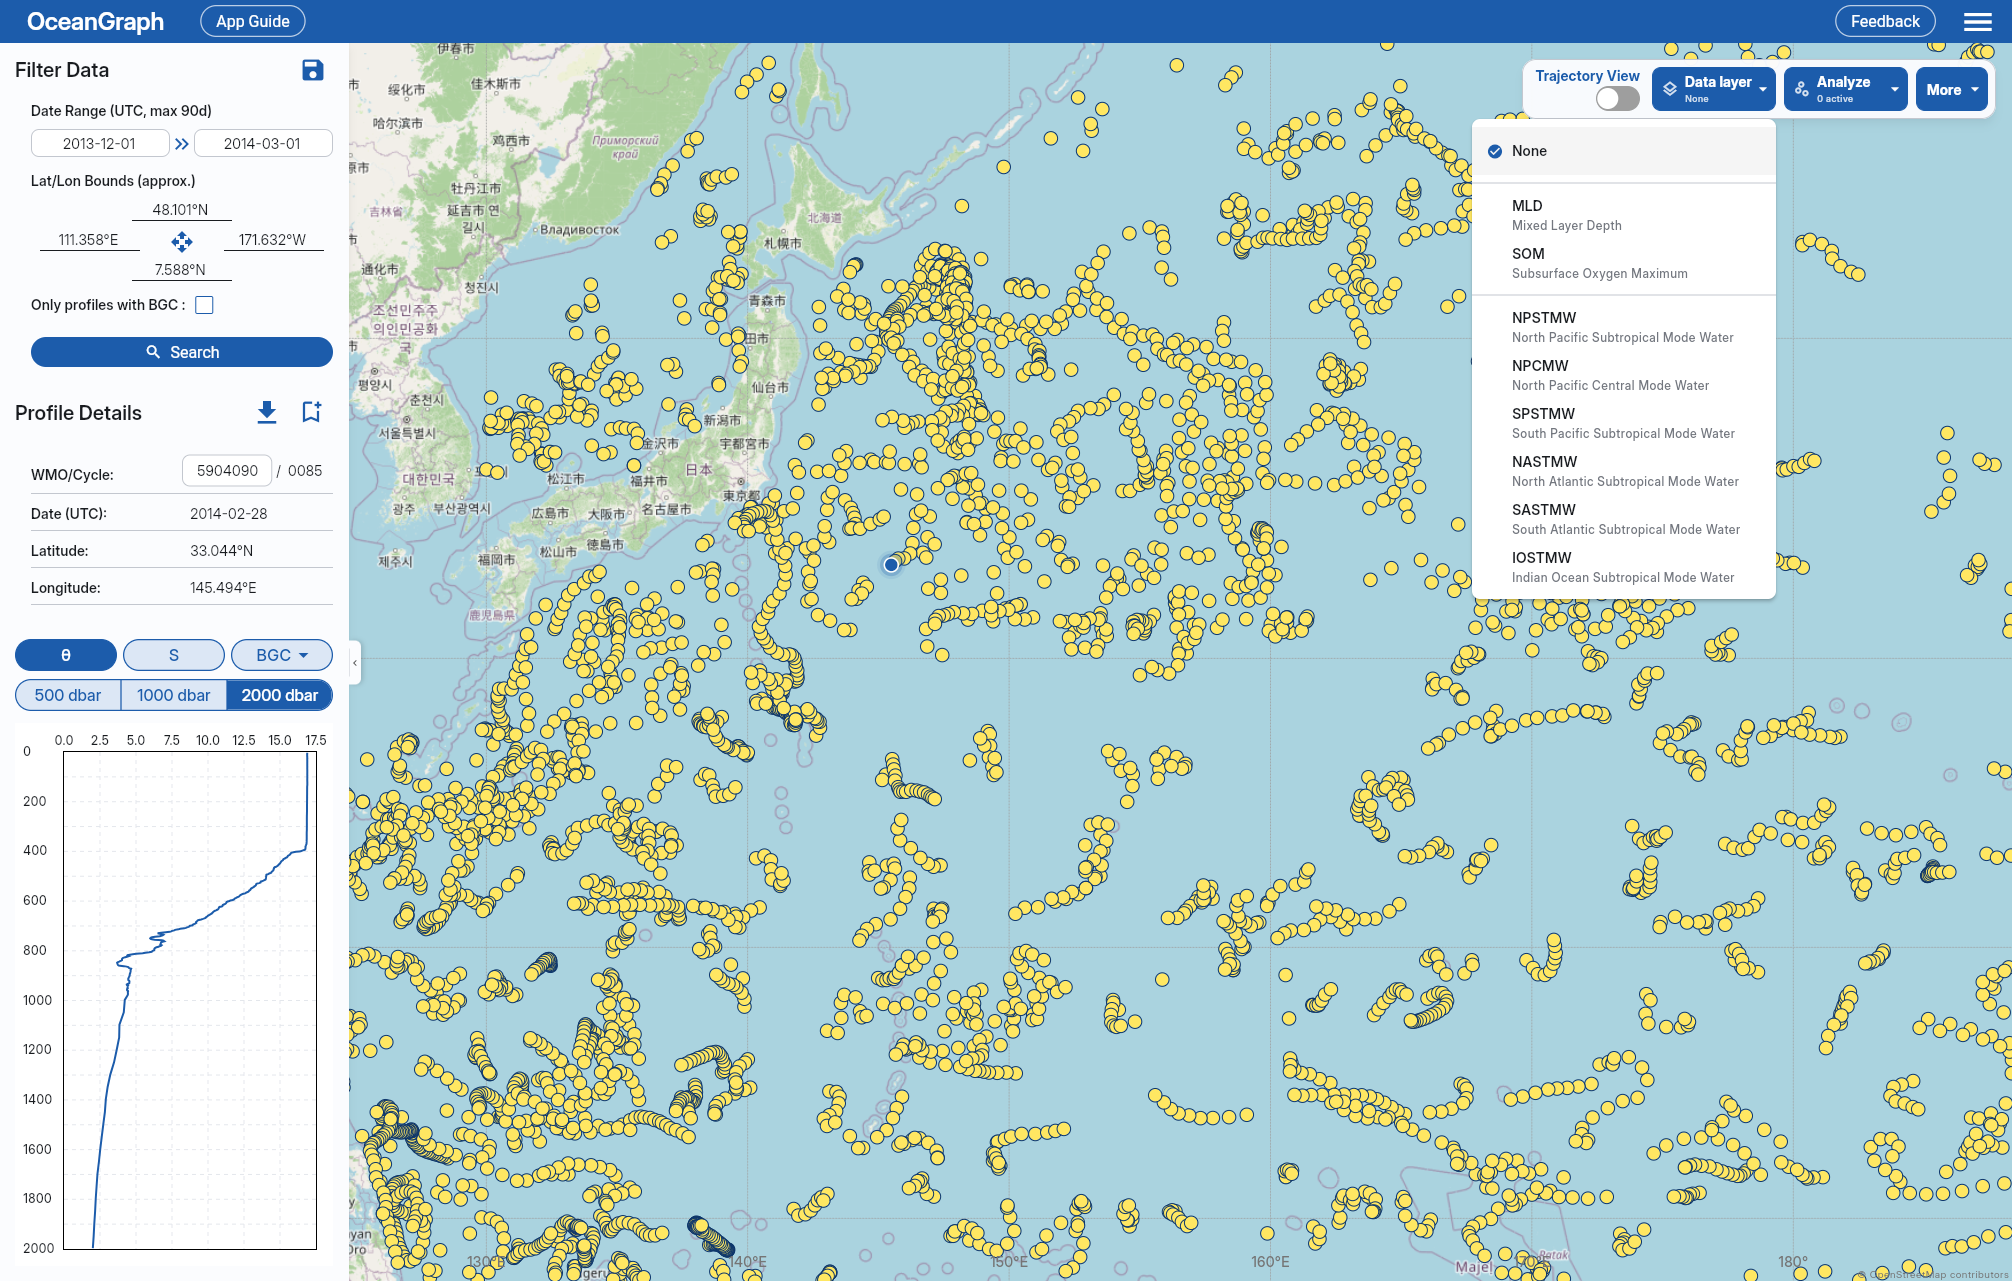
Data layer is one exclusive menu containing None, MLD, SOM, and every supported mode water. Selecting a mode water replaces MLD or SOM coloring, and selecting MLD or SOM replaces mode water coloring. Choose None to return to the default marker colors.
Marker Colors and Tooltips
When a mode water type is selected:
- Profiles with that mode water are colored by detected layer thickness.
- Profiles without that selected mode water are shown as no-data markers.
- The tooltip shows the selected mode water type, layer thickness, core depth, and that marker color represents thickness.
Color represents thickness and should be read as a relative visual cue, not as a separate classification variable.
Supported Mode Water Types
The region column reflects OceanGraph’s default advection processing scope, which searches broader areas that can include advected mode water signals. Density ranges use potential density anomaly referenced to 0 dbar (σ0) in kg/m³.
| Short name | Full name | Region | Density range |
|---|---|---|---|
| NPSTMW | North Pacific Subtropical Mode Water | 20°N-38°N, 130°E-180° | σ0 = 25.0–25.6 kg/m³ |
| NPCMW | North Pacific Central Mode Water | 20°N-45°N, 145°E-145°W | σ0 = 26.0–26.6 kg/m³ |
| SPSTMW | South Pacific Subtropical Mode Water | 25°S-42°S, 150°E-170°W | σ0 = 25.8–26.5 kg/m³ |
| NASTMW | North Atlantic Subtropical Mode Water | 20°N-42°N, 85°W-35°W | σ0 = 26.3–26.6 kg/m³ |
| SASTMW | South Atlantic Subtropical Mode Water | 25°S-42°S, 60°W-20°E | σ0 = 26.2–26.7 kg/m³ |
| IOSTMW | Indian Ocean Subtropical Mode Water | 25°S-45°S, 20°E-70°E | σ0 = 25.8–26.2 kg/m³ |
All listed mode water types use a maximum potential vorticity threshold of 2 × 10⁻¹⁰ m⁻¹s⁻¹ and a minimum detected layer thickness of 10 m.
Detection Summary
OceanGraph checks quality-controlled, interpolated potential temperature and absolute salinity against the configured region, density, potential-vorticity, and minimum-thickness criteria. Where potential vorticity cannot be calculated, the density criterion is used alone. Core depth is the midpoint of the detected layer after converting its top and bottom pressures to depth; it is not the depth of minimum potential vorticity. A profile can contain more than one detected type, but the map displays only the type selected in Data layer.
Interpreting No-Data Markers
A no-data marker does not necessarily mean the profile is unusable. It means the selected mode water type was not detected for that profile under OceanGraph’s current automatic criteria. Common reasons include:
- The profile is outside the selected mode water’s geographic bounds
- The density or potential vorticity criteria were not met
- The matching layer was thinner than the 10 m minimum required thickness
- The profile did not have enough valid data after quality control and interpolation
Mode water detection is intended as an exploration aid. For research-grade classification, inspect the original profile structure and apply the criteria appropriate to your study.