Limitations
Missing Values in Vertical Section Charts
-
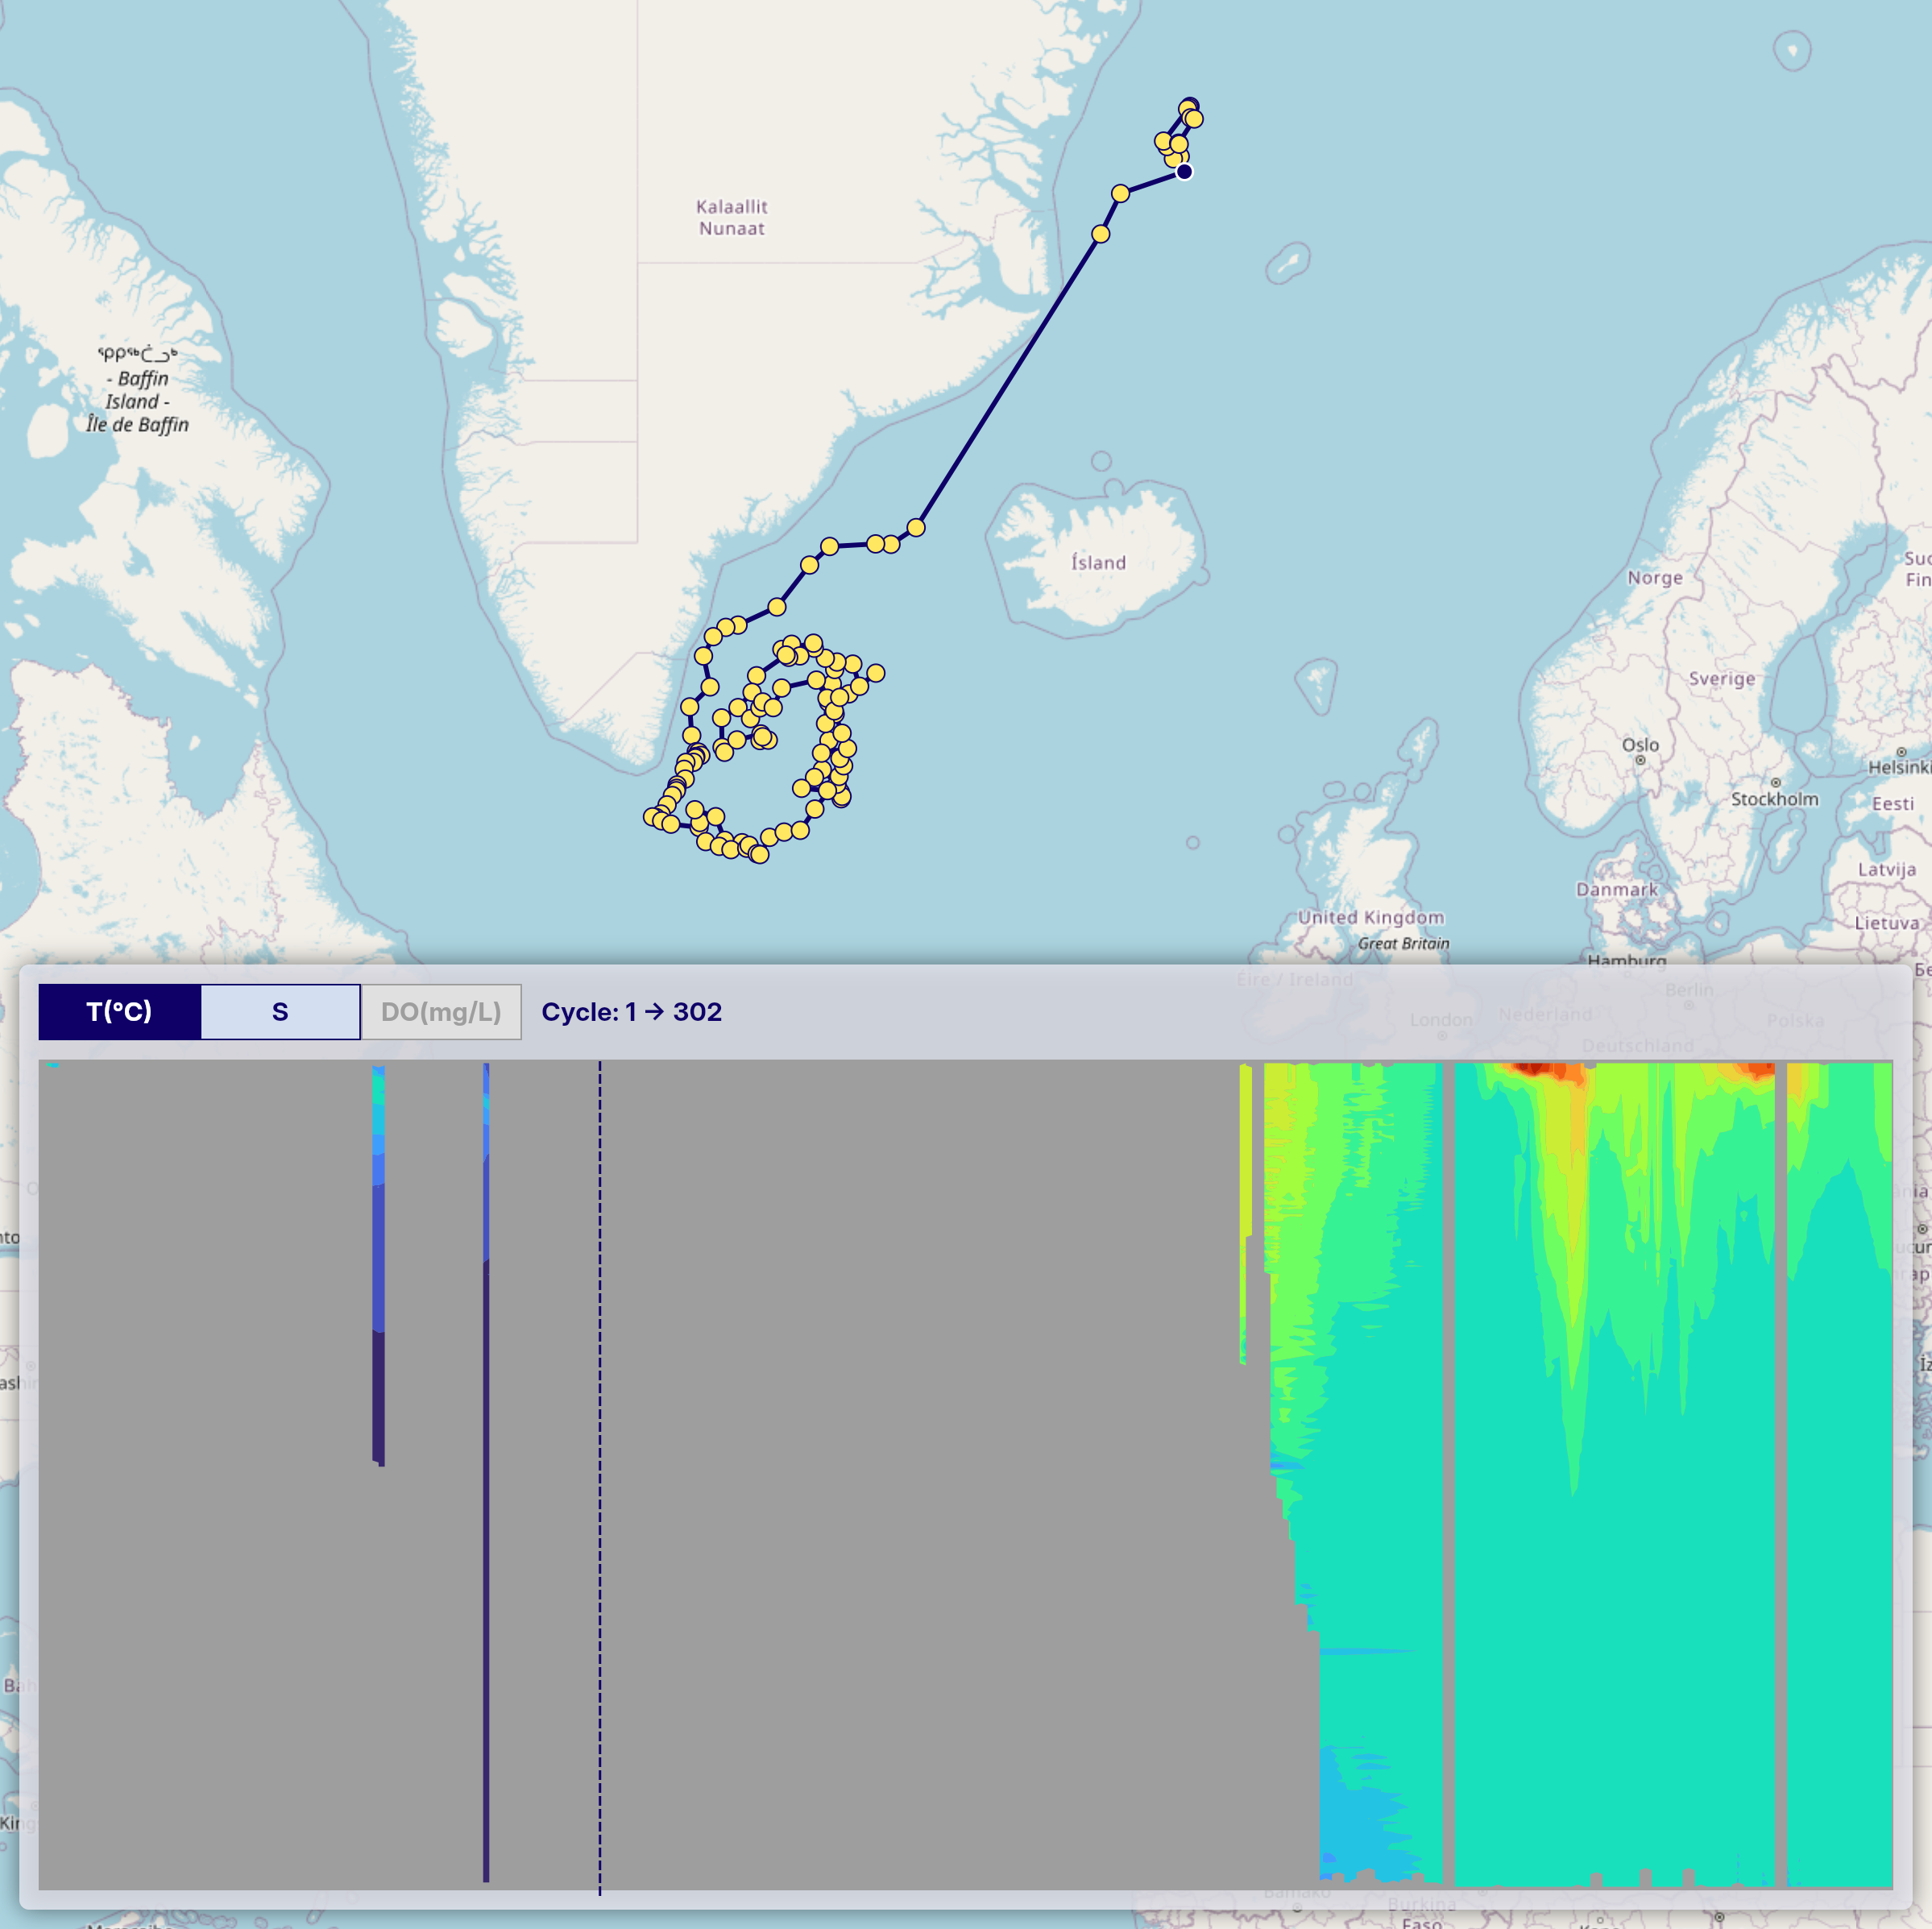
Masked Areas Without Original Data
When generating time-series vertical section charts, each profile is interpolated vertically onto a common pressure grid only between finite observations. OceanGraph does not interpolate along the cycle direction. A missing cycle therefore remains a missing column instead of becoming a smooth estimate between distant observations.
In the chart, these masked areas appear as uncolored gaps in the vertical section.
-
Sparse Data Due to Quality Control
After processing, some parameters can have finite values in isolated profiles but no pair of adjacent cycles with enough shared vertical support to form a contour cell. In that case OceanGraph does not publish an SVG for that parameter. The interface distinguishes this “profile data exists, but no drawable section” state from a parameter that has no profile data at all.
A parameter can therefore be available in individual profiles even when the section area reports that no chart can be drawn.
-
BGC Parameter Charts May Have More Missing Areas
Vertical section charts in the OceanGraph interface are also available for BGC parameters (dissolved oxygen, chlorophyll, nitrate, backscattering, pH, and PAR). Because only a subset of Argo floats carry BGC sensors, these variables often contain more
nullcells or isolated cycles than temperature and salinity. Finite BGC measurements are retained independently of missing temperature or salinity cells, but a section still requires adjacent-cycle support to be drawable.PAR observations are typically concentrated in the surface layer (roughly 0–200 dbar), so deeper portions of PAR section charts commonly appear as missing areas.
Note also that of the two irradiance parameters (
DOWN_IRRADIANCE490andDOWNWELLING_PAR), only PAR is displayed as an in-app chart. Downwelling irradiance at 490 nm can make a profile match the “Only profiles with BGC” search filter and is included in downloadable profile data, but it does not have a corresponding in-app visualization.
3D View
The 3D view combines quality-filtered profile values into horizontal surfaces without additional QC. Keep these limits in mind:
- Each variable uses its own valid observations, so BGC values remain available where θ or S is missing. Interpolation stays within each profile’s observed pressure range for that variable; deeper PAR layers commonly remain missing.
- A surface needs valid values at three or more distinct locations that do not lie on one straight line. Repeated profiles at the same location do not add locations.
- Within the area enclosed by valid locations, values are interpolated linearly. Outside that area, the nearest valid value is extended as extrapolation. Both are displayed only at grid points within 250 km of a valid location for that variable and pressure. Distance uses the selected region’s central latitude to scale longitude.
- Areas beyond this limit remain blank, even inside the area enclosed by observations. Blank areas do not mean that the variable is zero or that no water is present.
- The distance limit controls display coverage; it is not a scientific correlation length or an accuracy guarantee. Distant observations can still influence an interpolated value near a valid location.
- Sparse observations and the 0.5° grid can produce coarse contours. Grid spacing and smooth-looking colors do not indicate measurement accuracy.
- Boost contrast expands even small differences across the full palette without changing values or missing areas; colors do not establish scientific significance or identify anomalies. Its scale applies only to the selected layer, so matching colors across layers or after changing depth need not mean matching values.
- Land and seafloor boundaries are ignored.
- Observations from different times are combined without time correction. This exploratory view does not reconstruct a single-time or period-average ocean field. Seasonal and other changes over time can appear as spatial differences, especially in long WMO histories. Check the displayed observation period for every view, including those from geographic searches.
- Horizontal proportions approximate geographic distances, but the pressure direction is exaggerated for readability. The axes do not share one physical distance scale.
Derived Metrics and Mode Water Detection
Derived metrics such as MLD, SOM, and mode water detections are calculated automatically from profiles that pass OceanGraph’s data processing checks. A no-data marker can mean that the source profile was insufficient for the calculation, or that the target feature was not detected under the current criteria.
Mode water detection uses fixed geographic, density, potential vorticity, and minimum-thickness criteria. The default geographic scope is configured to cover broader areas that can include advected mode water signals, but it is still an automatic bounding-box screen and may not cover every scientifically relevant signal. Treat the map data layer and Visual Lab summaries as exploration aids, and inspect the original profile structure when a research-grade classification is required.