θ-S Diagram
The θ-S diagram feature allows you to visualize potential temperature-absolute salinity relationships of Argo float profiles in the current search area.
Accessing θ-S Diagram
The θ-S diagram is available to logged-in users only.
- After performing a search, click the View θ-S button in the top-right corner of the map
- The system will generate a θ-S diagram based on the current search results
- The diagram appears as an overlay on the map
Profile Limit
- Maximum 500 profiles can be used to generate a θ-S diagram
- If your search contains more than 500 profiles, an error message will appear
- Narrow your search criteria to reduce the number of profiles
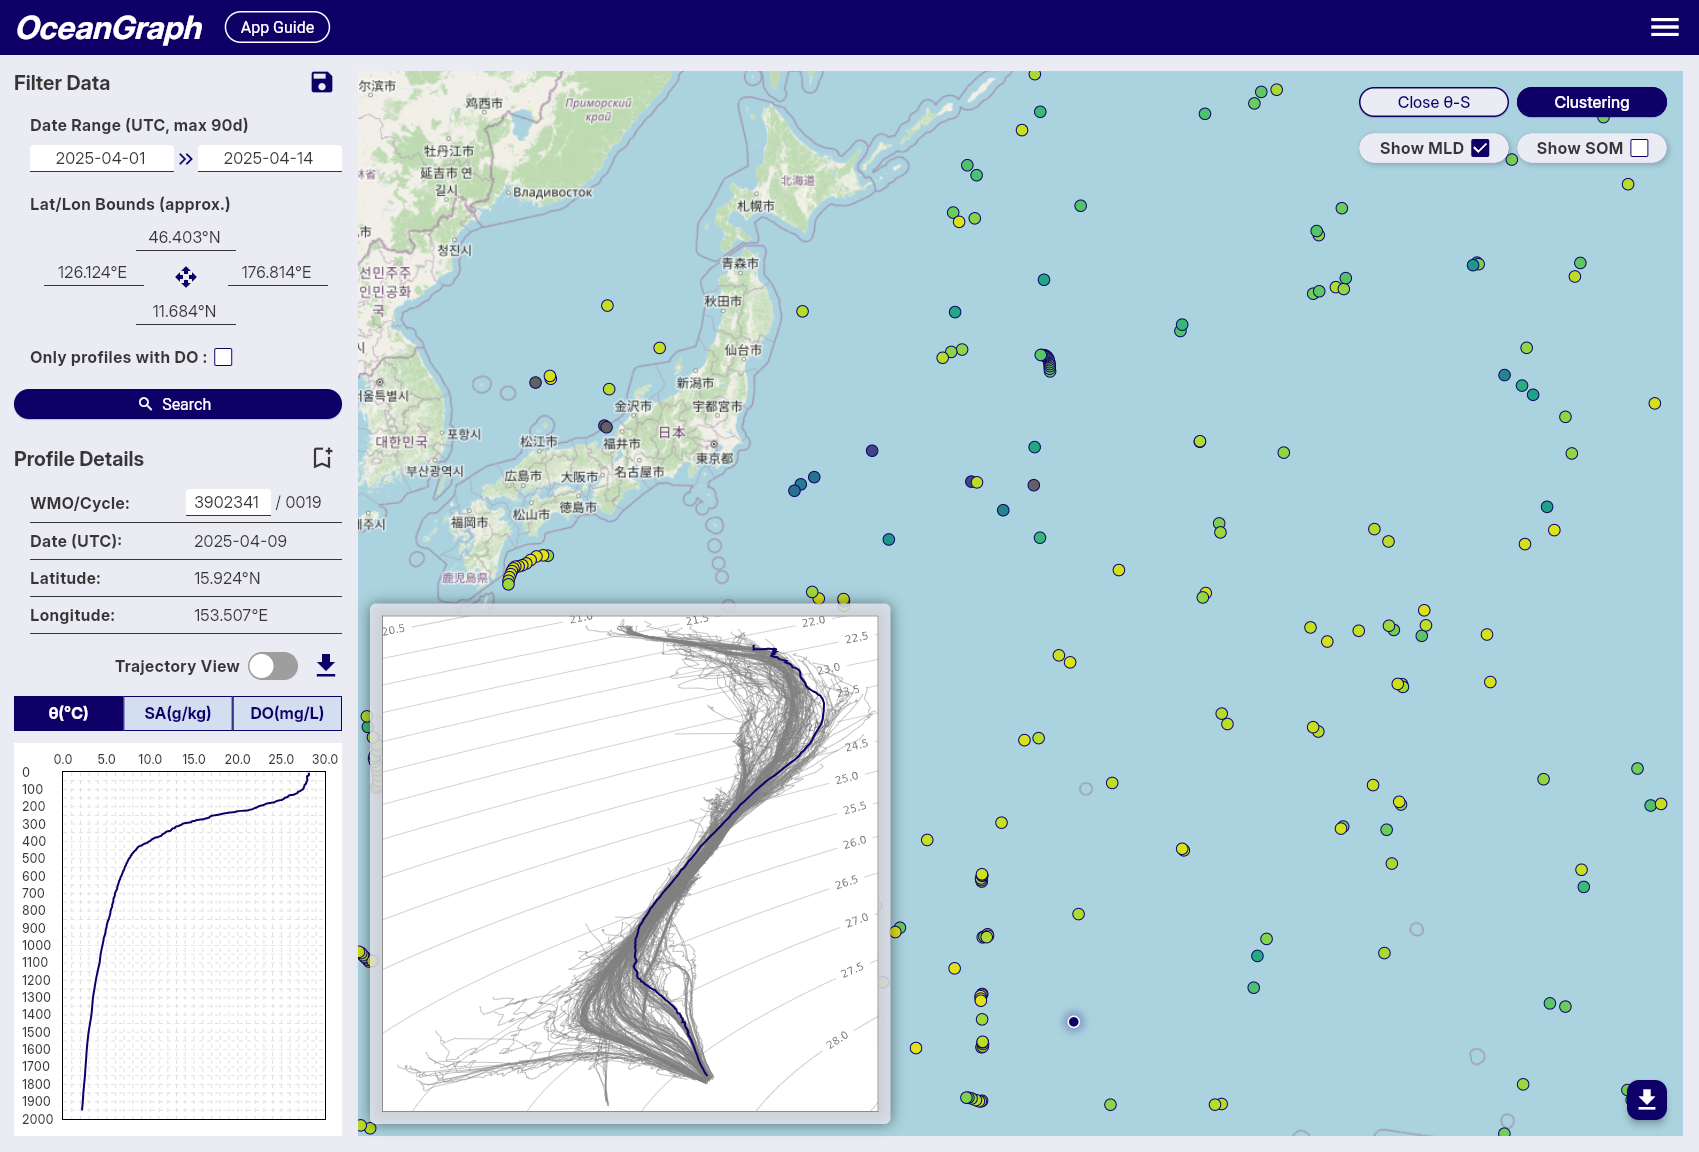
θ-S Diagram Display
Background Chart
- Shows potential temperature (vertical axis) vs absolute salinity (horizontal axis) relationships
- Displays density contour lines and water mass boundaries
Selected Profile Line
- When you select a float on the map, its temperature-salinity profile is highlighted
- Appears as a colored line overlaying the background chart
- Updates automatically when you select different floats
Tips
- Use it to identify different water masses and their characteristics
- The diagram helps understand the oceanographic context of your selected profiles
Background
A θ-S diagram (Temperature-Salinity diagram) is a fundamental tool in oceanography for:
- Identifying water masses and their properties
- Understanding mixing processes between different water types
- Analyzing the vertical structure of the water column
- Detecting seasonal and regional variations in ocean properties