Ocean Basins
Overview
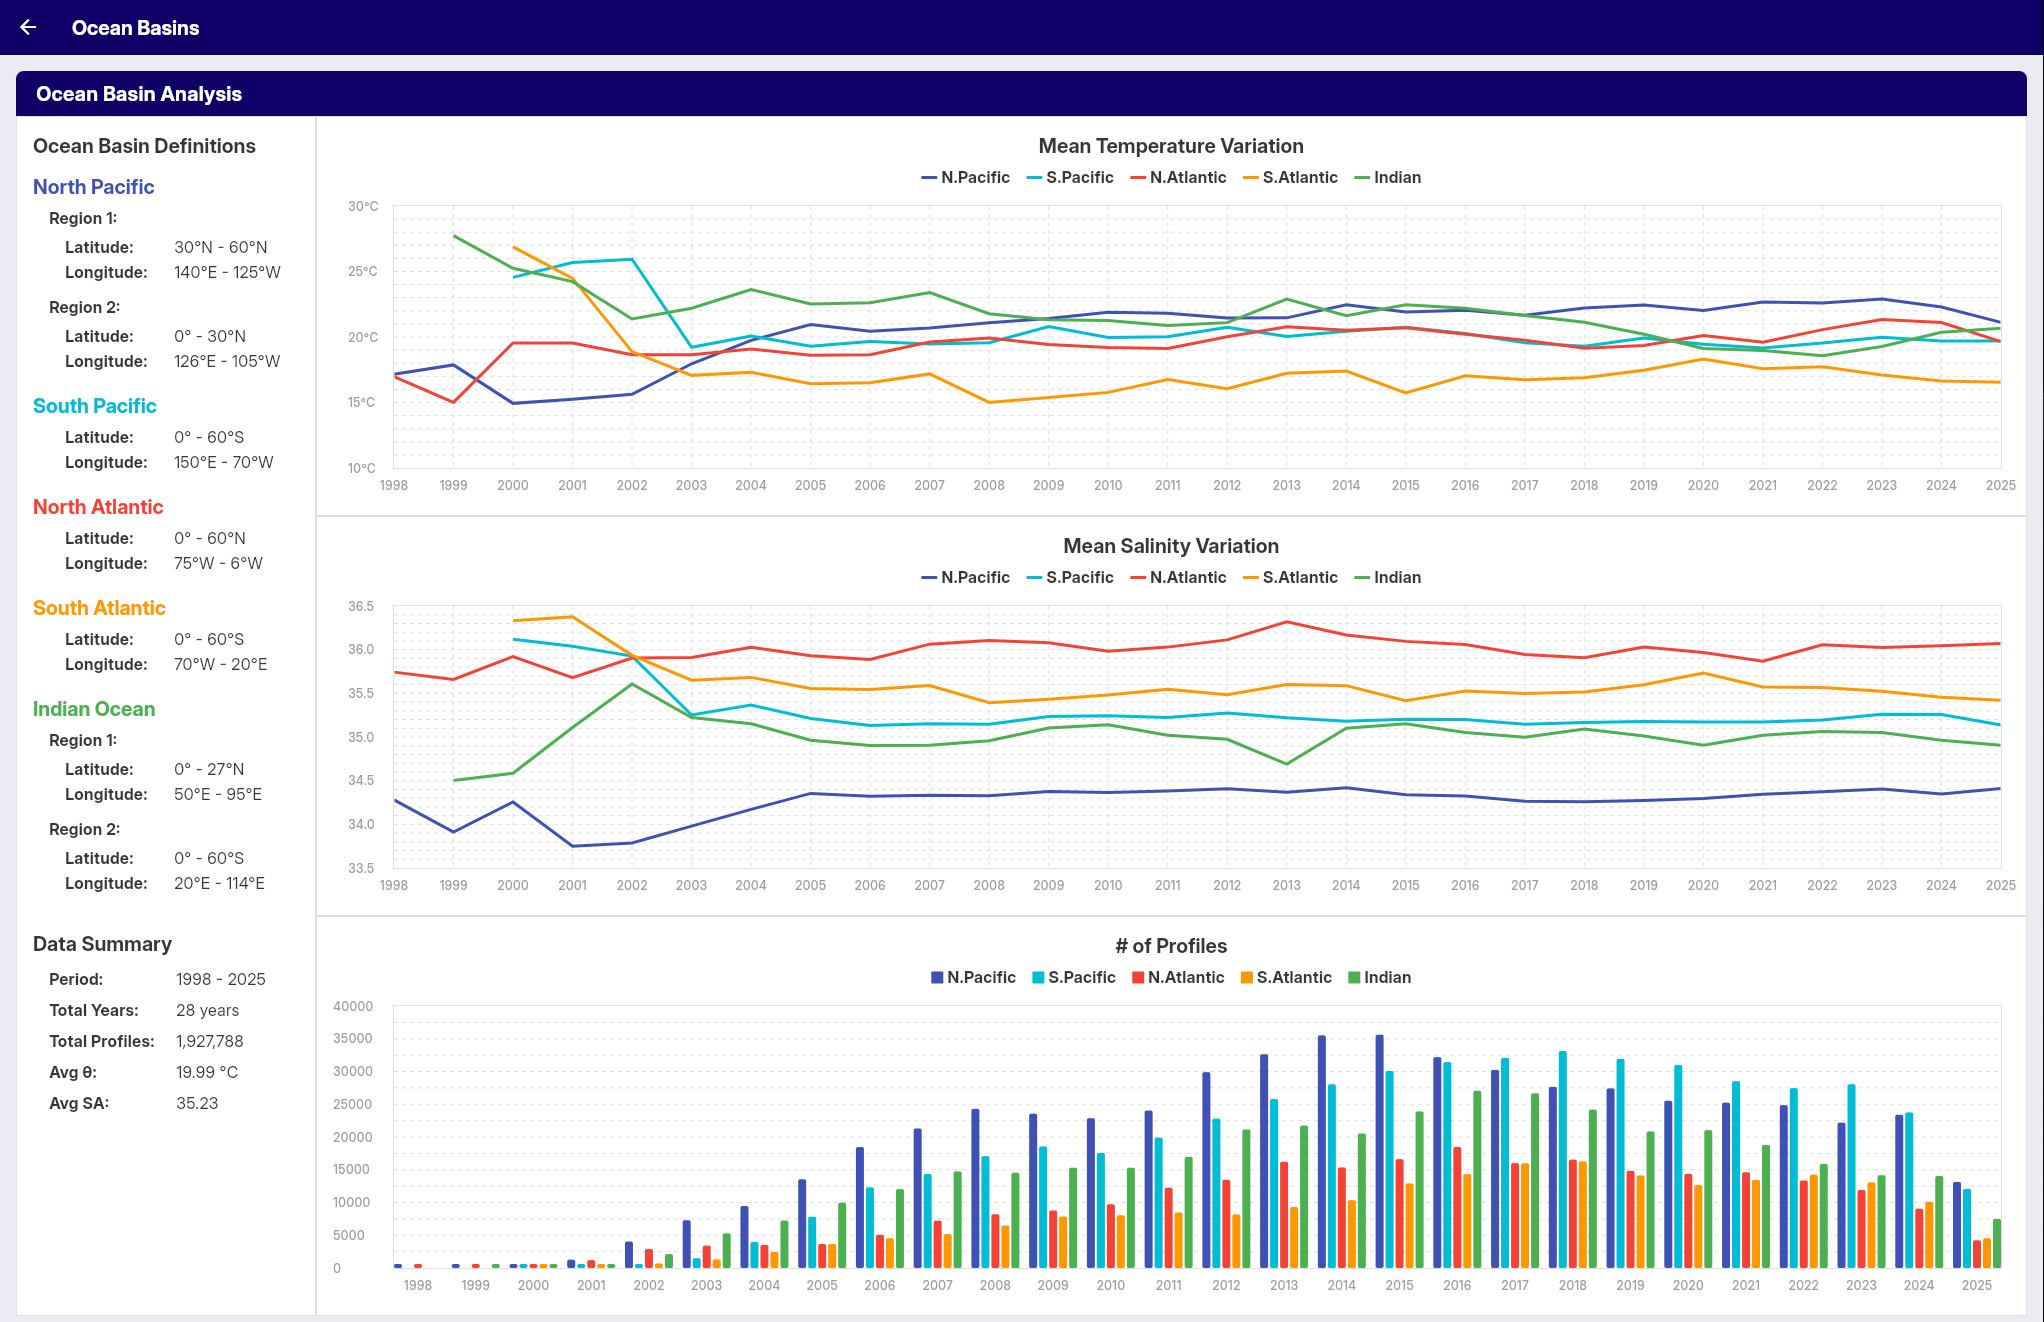
The Ocean Basins feature provides time series visualization of average temperature and salinity changes across the world's major ocean basins. This tool displays long-term oceanographic trends using Argo float data from 1998 to the present.
Ocean Basins Coverage
The analysis covers five major ocean basins: North Pacific, South Pacific, North Atlantic, South Atlantic, and Indian Ocean. Each basin's data is analyzed separately to reveal regional trends.
Data Visualization
Temperature and Salinity Graphs
The feature displays two main types of time series:
- Average Temperature: Long-term trends in ocean potential temperature by basin
- Average Salinity: Long-term trends in ocean absolute salinity by basin
Data Parameters
- Temperature: Potential temperature (θ) values at 10 dbar depth
- Salinity: Absolute salinity (SA) values at 10 dbar depth
Time Period
- Coverage: 1998 to present year
- Data Source: Argo float profile measurements interpolated using the Akima method
- Temporal Resolution: Annual
Profile Count Display
The visualization includes an additional bar chart showing:
- Annual Profile Count: Number of Argo profiles used each year for each basin
This profile count chart helps users understand data density and reliability over time.
Applications
This tool is useful for:
- Understanding regional ocean climate variations
- Identifying long-term trends in ocean temperature and salinity
- Comparing oceanographic changes between different basins
- Educational purposes and oceanographic research