Exploring Analysis Results
Visual Lab
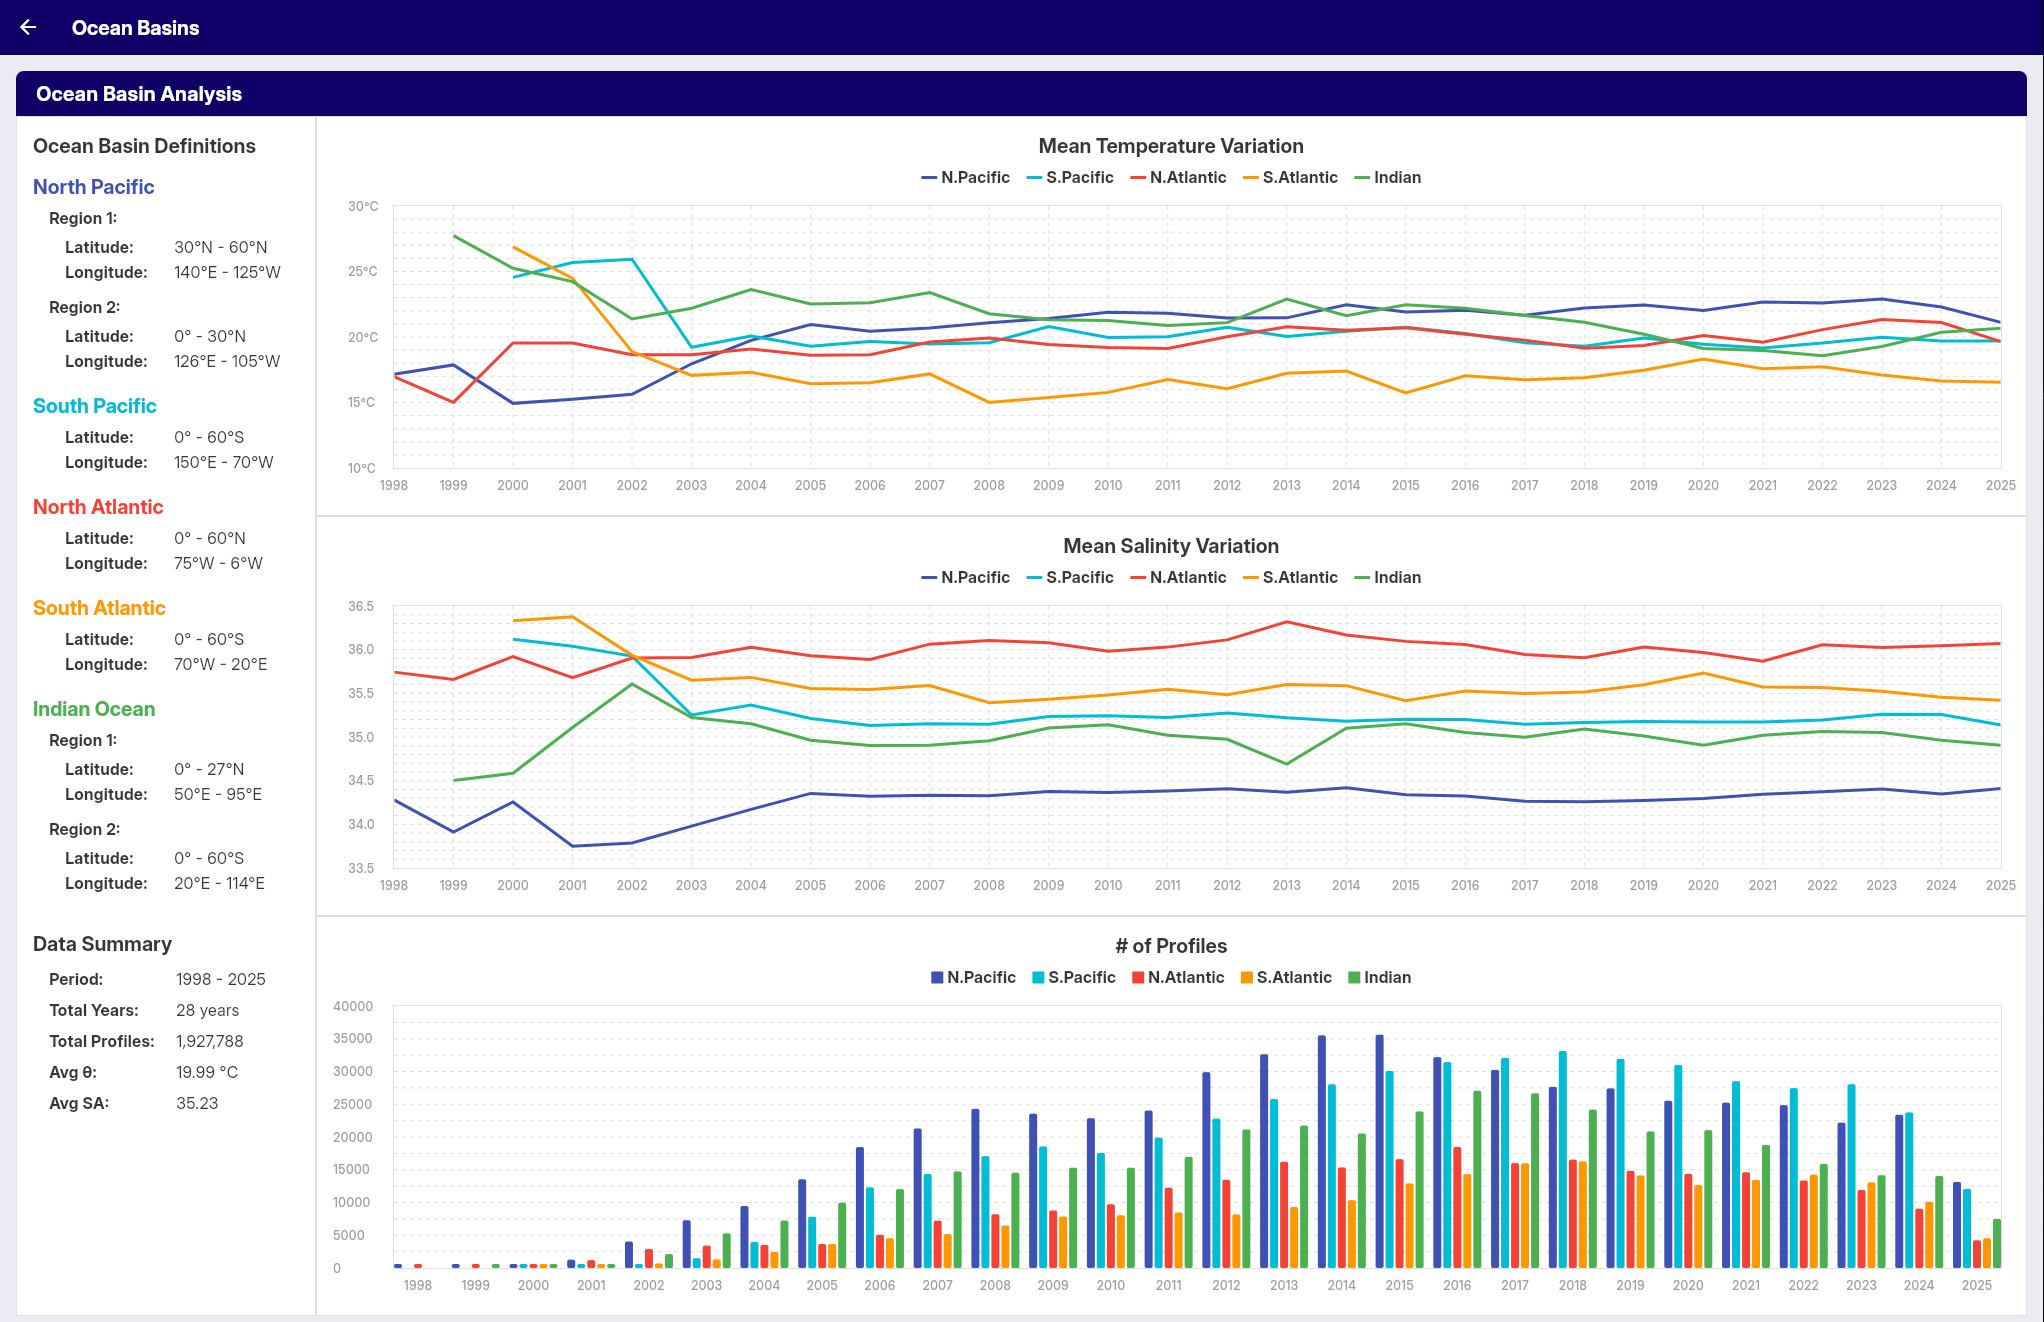
Ocean Basins
Overview
The Ocean Basins feature provides time series visualization of average temperature and salinity changes across the world's major ocean basins. This tool displays long-term oceanographic trends using Argo float data from 1998 to the present.
Ocean Basins Coverage
The analysis covers five major ocean basins: North Pacific, South Pacific, North Atlantic, South Atlantic, and Indian Ocean. Each basin's data is analyzed separately to reveal regional trends.
Data Visualization
Temperature and Salinity Graphs
The feature displays two main types of time series:
- Average Temperature: Long-term trends in ocean potential temperature by basin
- Average Salinity: Long-term trends in ocean absolute salinity by basin
Data Parameters
- Temperature: Potential temperature (θ) values at 10 dbar depth
- Salinity: Absolute salinity (SA) values at 10 dbar depth
Time Period
- Coverage: 1998 to present year
- Data Source: Argo float profile measurements interpolated using the Akima method
- Temporal Resolution: Annual
Profile Count Display
The visualization includes an additional bar chart showing:
- Annual Profile Count: Number of Argo profiles used each year for each basin
This profile count chart helps users understand data density and reliability over time.
Applications
This tool is useful for:
- Understanding regional ocean climate variations
- Identifying long-term trends in ocean temperature and salinity
- Comparing oceanographic changes between different basins
- Educational purposes and oceanographic research
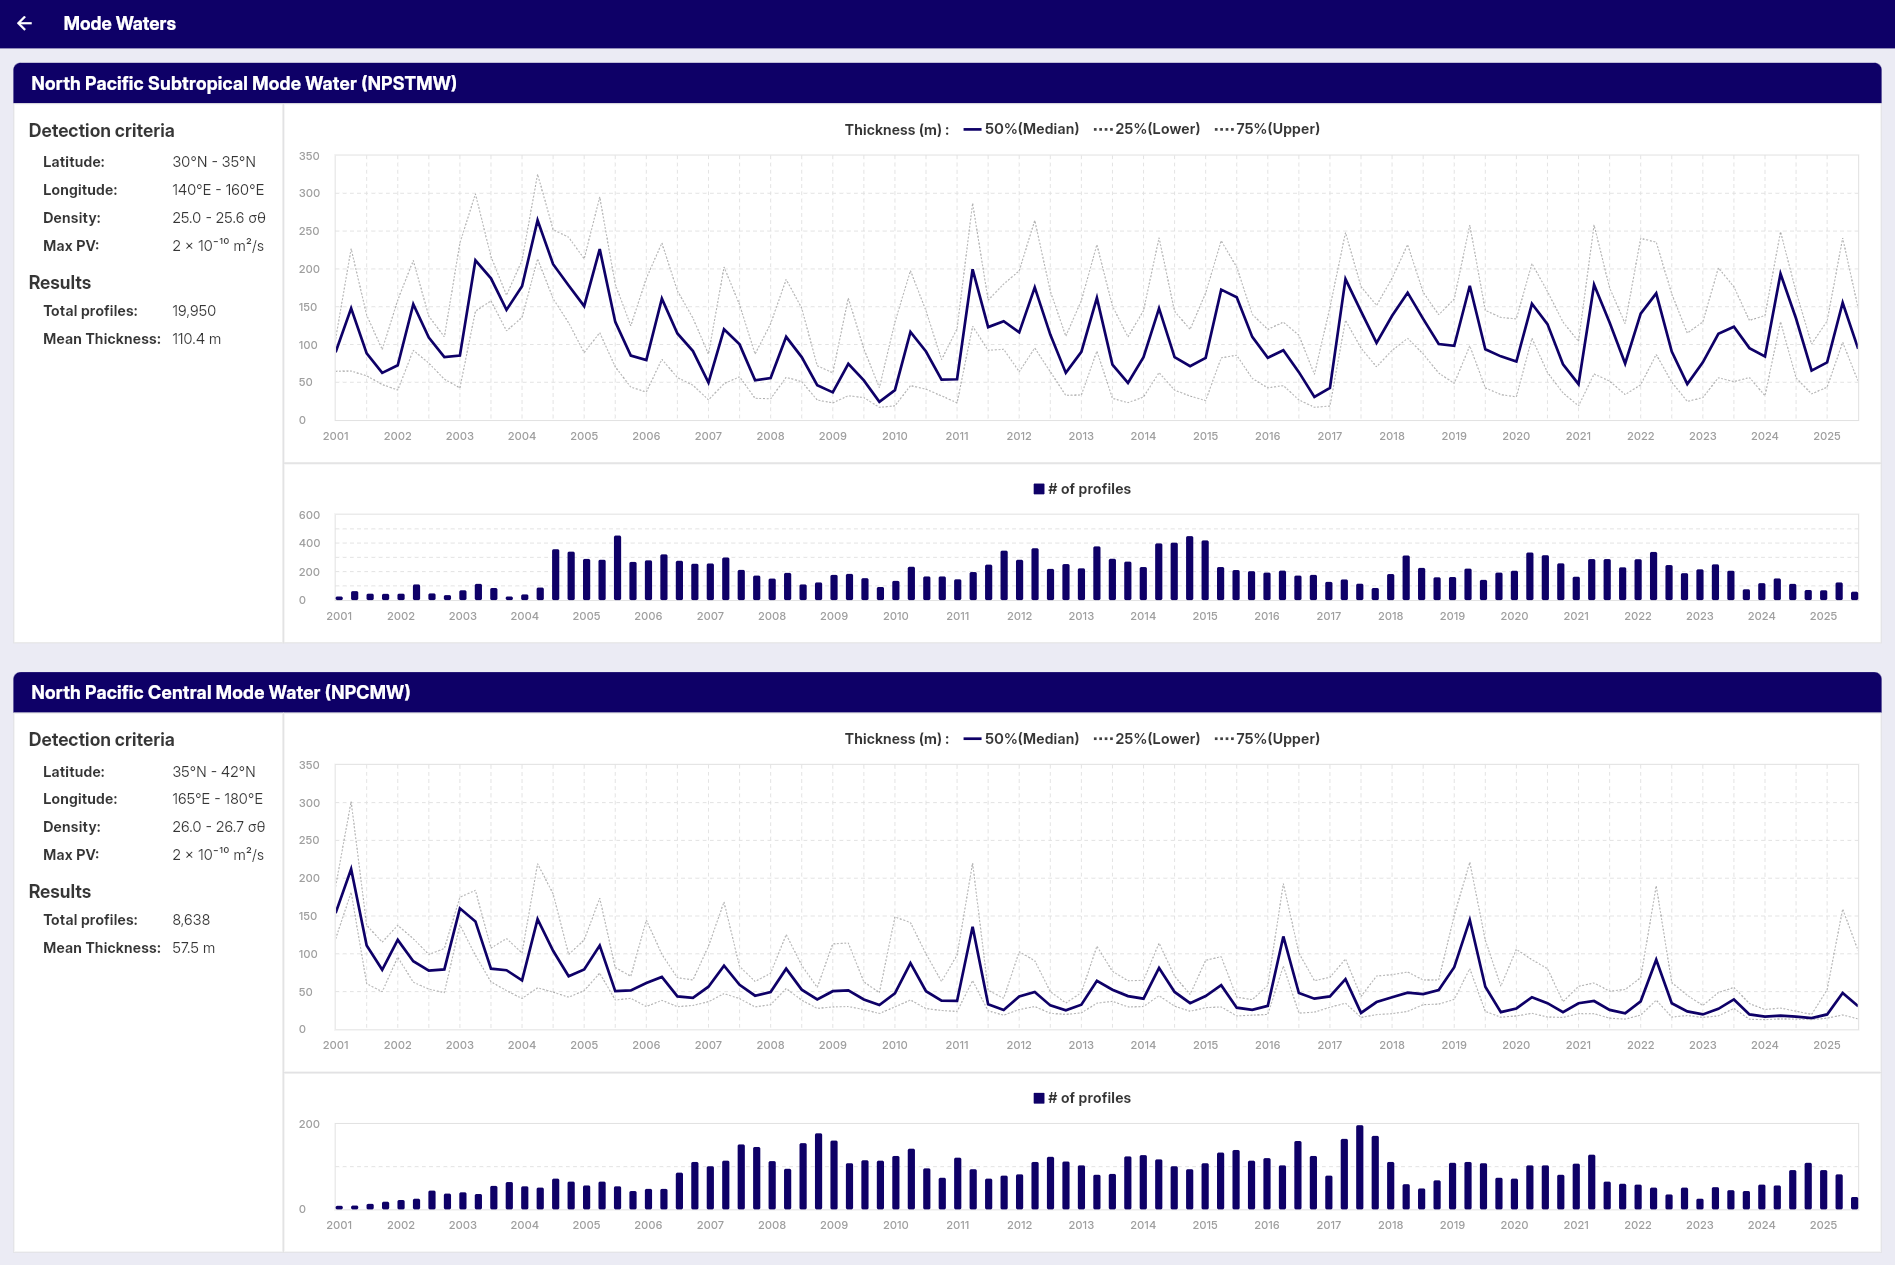
Mode Water Analysis
The Mode Water Analysis feature displays the detection and time series visualization of mode water layers in Argo float profiles.
This tool provides:
- Detection of mode water layers in profiles based on specified criteria
- Count of profiles containing mode water by season
- Time series visualization of mode water thickness trends
- Statistical display of thickness values (median and quartiles)
Detection Criteria
Mode water detection uses criteria displayed on the screen (latitude/longitude bounds, density range, potential vorticity threshold, and minimum thickness).
Results Display
The panel displays:
- Total Profiles: Number of profiles containing detected mode water layers
- Mean Thickness: Average thickness of detected mode water layers
Graphs
Time Series Graph
Displays mode water thickness over time:
- Median Thickness: 50th percentile (solid blue line)
- Lower Quartile: 25th percentile (dashed gray line)
- Upper Quartile: 75th percentile (dashed gray line)
- Time Scale: Seasonal data from 2001 onwards
Profile Count Graph
Shows the number of profiles containing mode water:
- Blue Bars: Number of profiles per season
- Time Scale: Seasonal data from 2001 onwards
Data Processing
Quality Control
The analysis applies strict quality control measures to ensure reliable results:
-
Geographic Filtering
- Only profiles within the specified target region are analyzed
- Profiles outside the geographic bounds are excluded
-
Profile Depth Requirements
- Minimum profile depth: 500 dbar (approximately 500m)
- Profiles that are too shallow are excluded from analysis
-
Data Completeness
- Minimum 10 valid data points required per profile (temperature, salinity, pressure)
- Minimum 5 valid density data points required for mode water calculation
- Minimum 3 valid data points required for potential vorticity calculation
- Profiles with insufficient temperature, salinity, or pressure data are excluded
- Missing or invalid data points are removed before analysis
- Mode water layers must be ≥10m thickness to be included in analysis
Seasonal Grouping
Data is grouped by meteorological seasons:
- Winter: December, January, February
- Spring: March, April, May
- Summer: June, July, August
- Autumn: September, October, November
Background
Mode waters are water masses characterized by weak vertical gradients in temperature and salinity, forming relatively uniform layers. They are created by deep winter mixed layers and play important roles in ocean circulation.
This feature displays basic statistics and time series of detected mode water layers in the specified region.